Driving Retention Rate for Hotel Booking Site
Identify Customer Features on First Visit
# To protect company information, the company name, actual data, and conclusion details have not been disclosed. All data has been adjusted for reference purposes only.
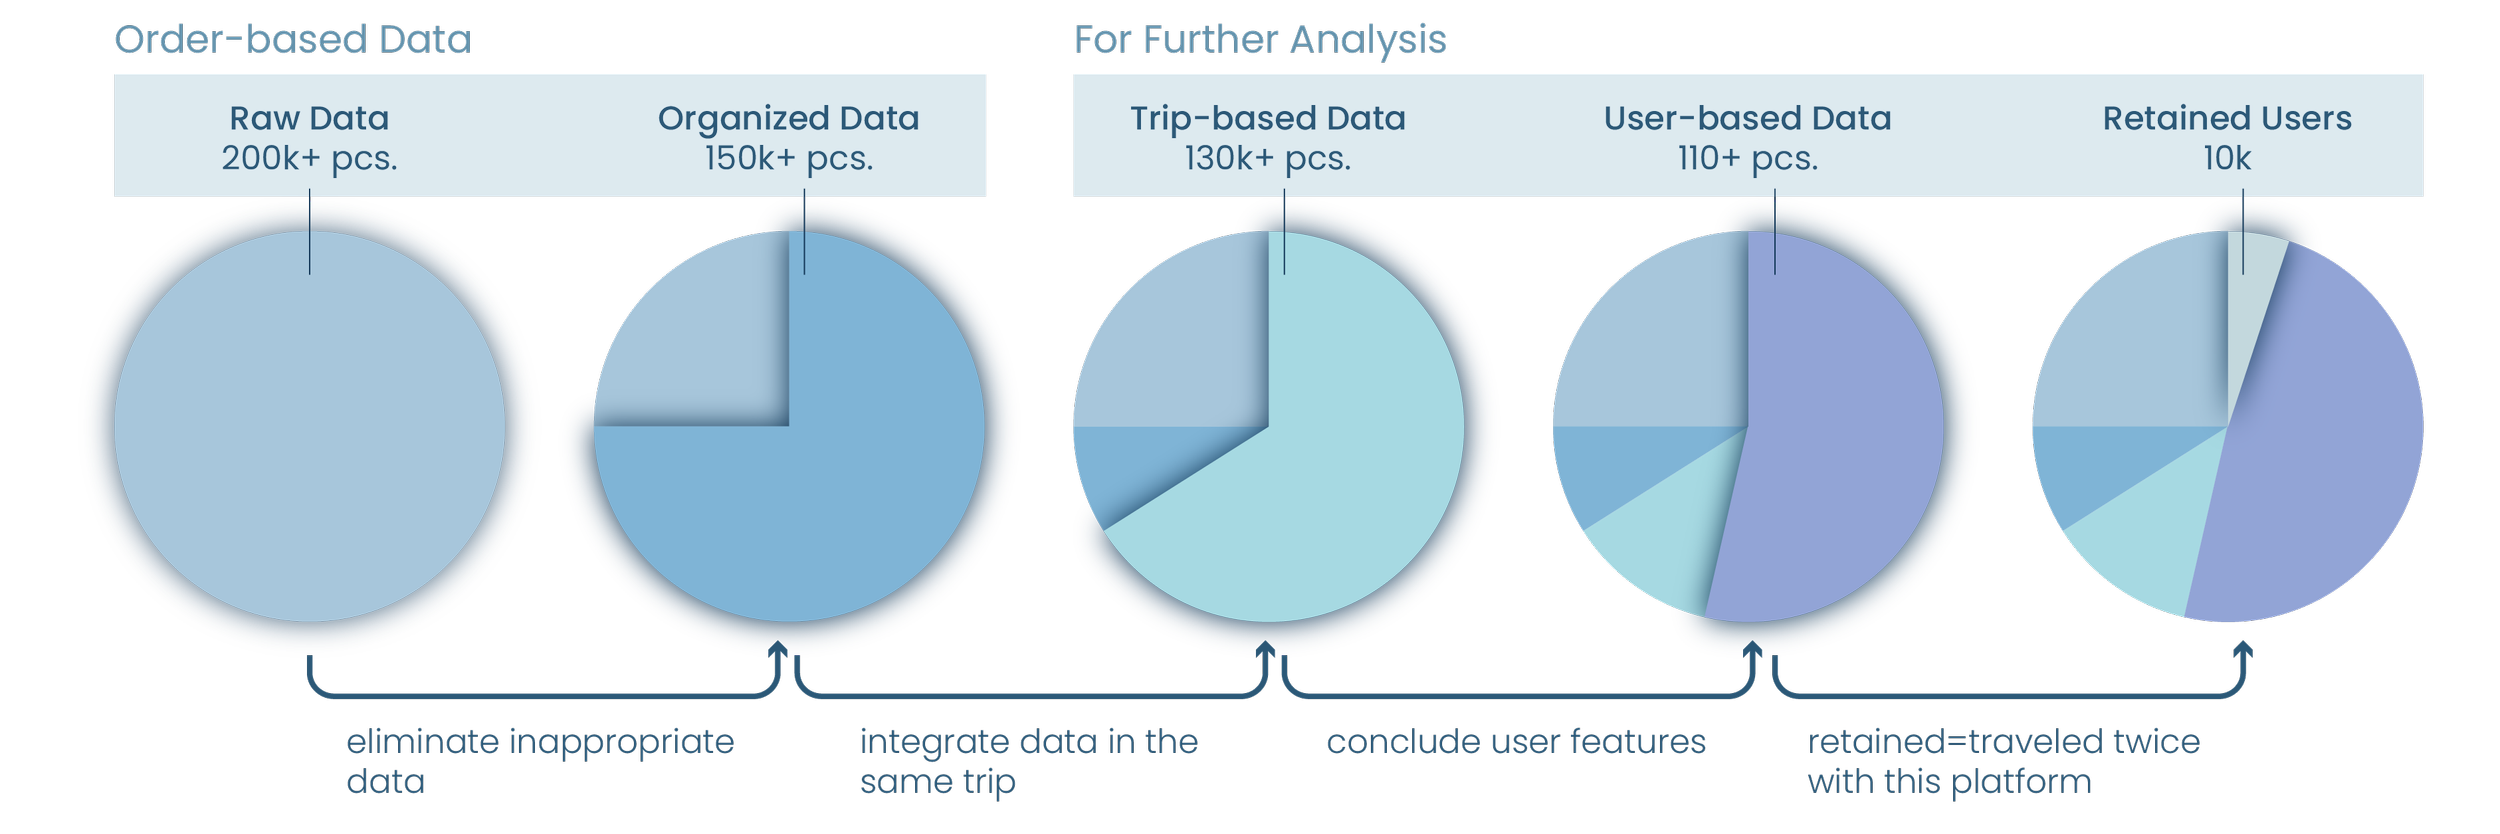
Our industry client, a hotel booking site, aims to raise its user retention rate from less than 10%. We looked into all of their online orders in the past two years (200k+ in total) with 36 data fields.
< 10%
current retention rate
200,000+
the number of orders in the past two years
36
recorded data fields
Trips and Users, instead of Orders
To dig more insight from order data sets, we transformed the data from “order-based” into “trip-based” and “user-based.” In comparison with the original data, trip-based data describes customer experience more comprehensively, considering that an overnight stay is merely one part of a trip. Meanwhile, user-based data allowed us to understand user features and preferences. We also defined “retained users” as those who have traveled twice with this booking platform (meaning they have > 1 piece of trip data).
The following report is analyzed with two kinds of reorganized data: 130k+ pieces of trip-basd data with 30 data fields, and 110k+ pieces of user-based data with 16 data fields.
Insufficient Data for Non-retained Users
The challenge came when we realized that the retention rate was extremely low – less than 10%! We were required to retain users who did not leave us enough data to understand or compare with others.
Disparity
The disparity between the retained and non-retained users is too great, making methods like decision trees ineffective for analysis.
Single Trip
The non-retained users have only planned a single trip through the booking site, leaving insufficient data to analyze user behavior.
Heterogeneity
The retained users are not a homogeneous group, therefore if analyzed as a whole, the results would be shallow and non-applicable.
Thus, we needed to figure out which features were shared between retained users and new users (those who just made their first orders), so that we could identify and classify every single user before missing the chance to know them better.
How We Did It
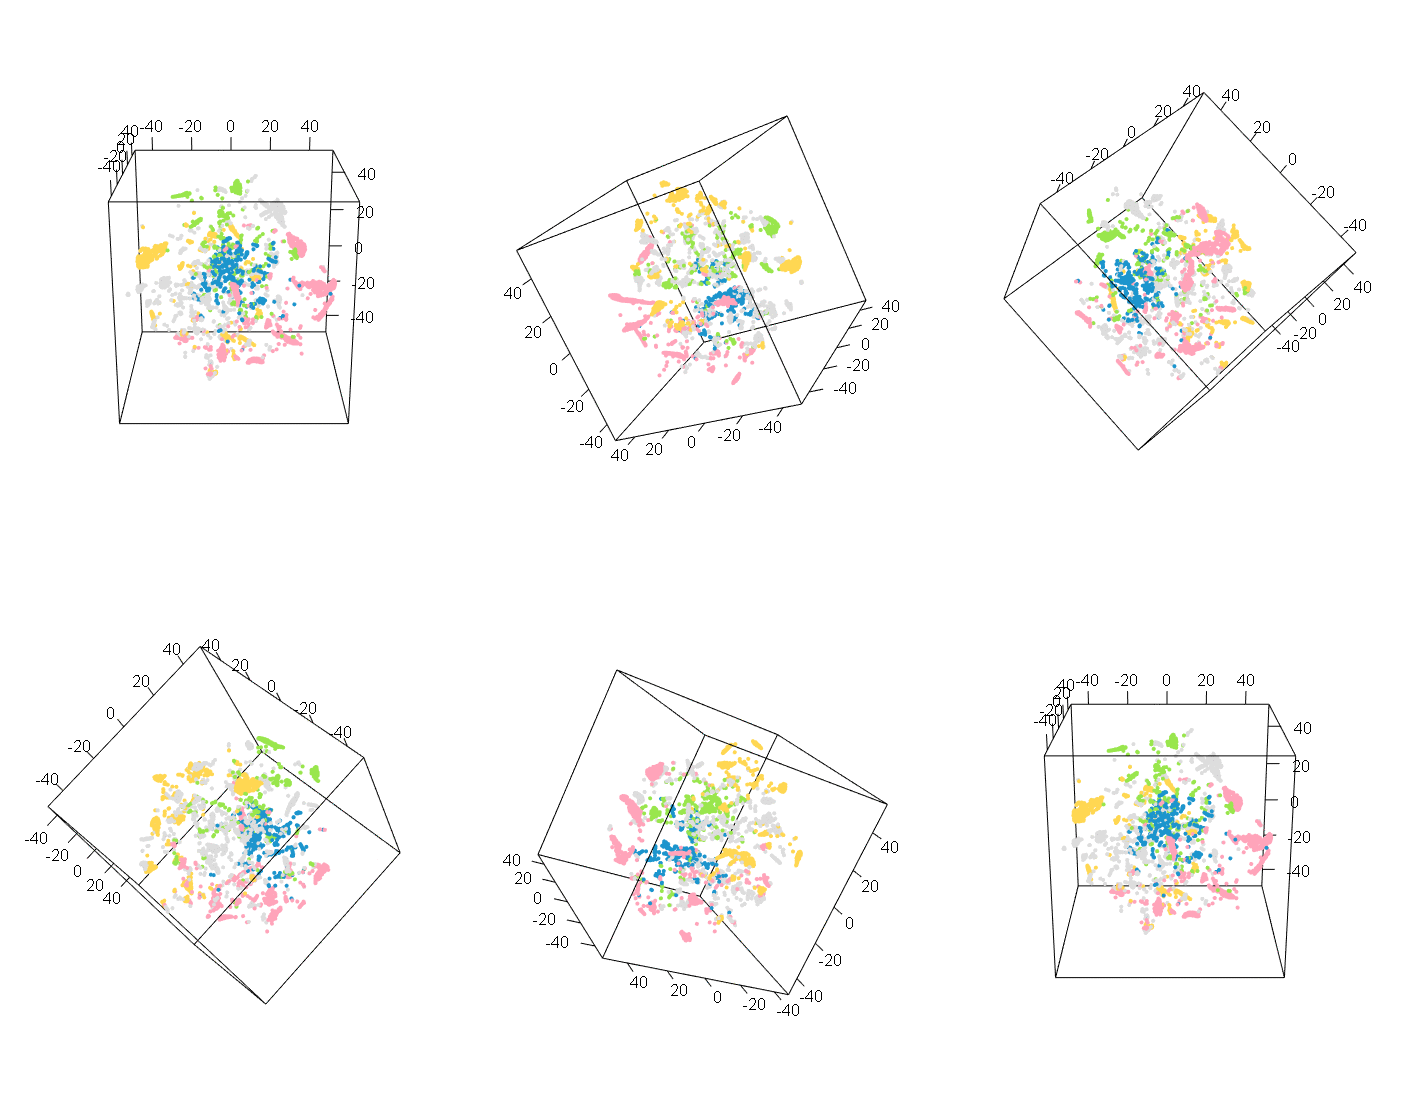
We split our retained users into groups and analyzed the features of each group on their first trip, then, we identified non-retained users with those corresponding features, in order to convert them into potential retained users.
Identified: 4 Groups
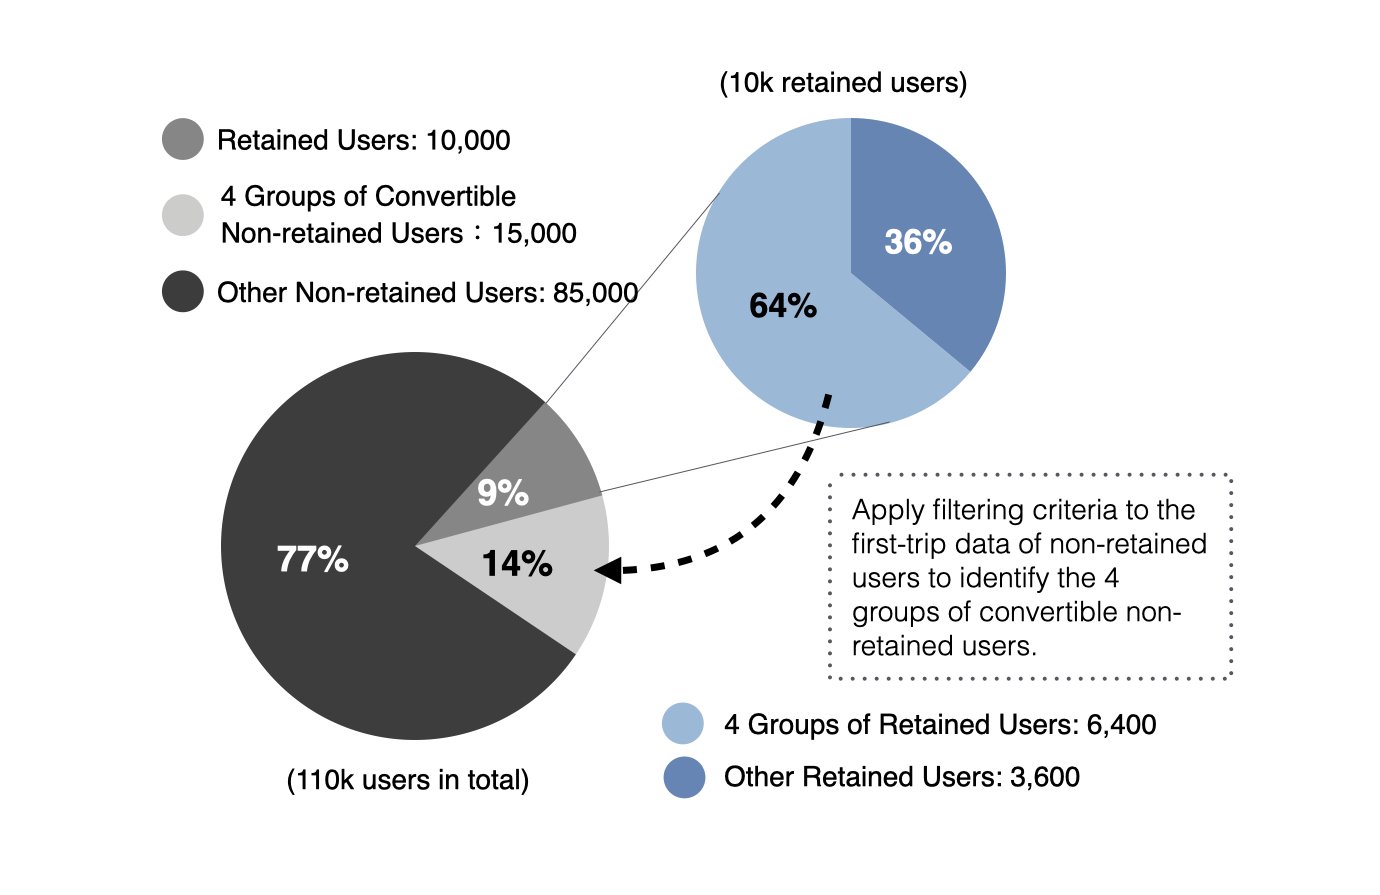
In the end, a total of 7 groups were categorized. After excluding the 3 groups with non-significant user features, 4 groups were identified — including young couples, retired couples, oversea visitors and non-sensitive to prices. We further identified 4 groups of convertible non-retained users that can be categorized into each group.
Increased: 150% More Potential Retained Users
In conclusion, based on the features of the 4 retained groups, we identified similar non-retained users, which are potential targets for conversion. By this means, we picked out 15k+ potential convertible users from 100k non-retained users, and designed four specialized marketing plans, which held the potential of increasing the number of retained users to 25k from the original 10k, an increase of 150%.
Duration
2020/03 – 2020/06
Instructor
Dr. Chun-Yu Yu
Team Leader
Hsin-Ming Chao
Team Members
Chien-Yu Yeh, Yi-Ling Lo, Fang-Yu Liang
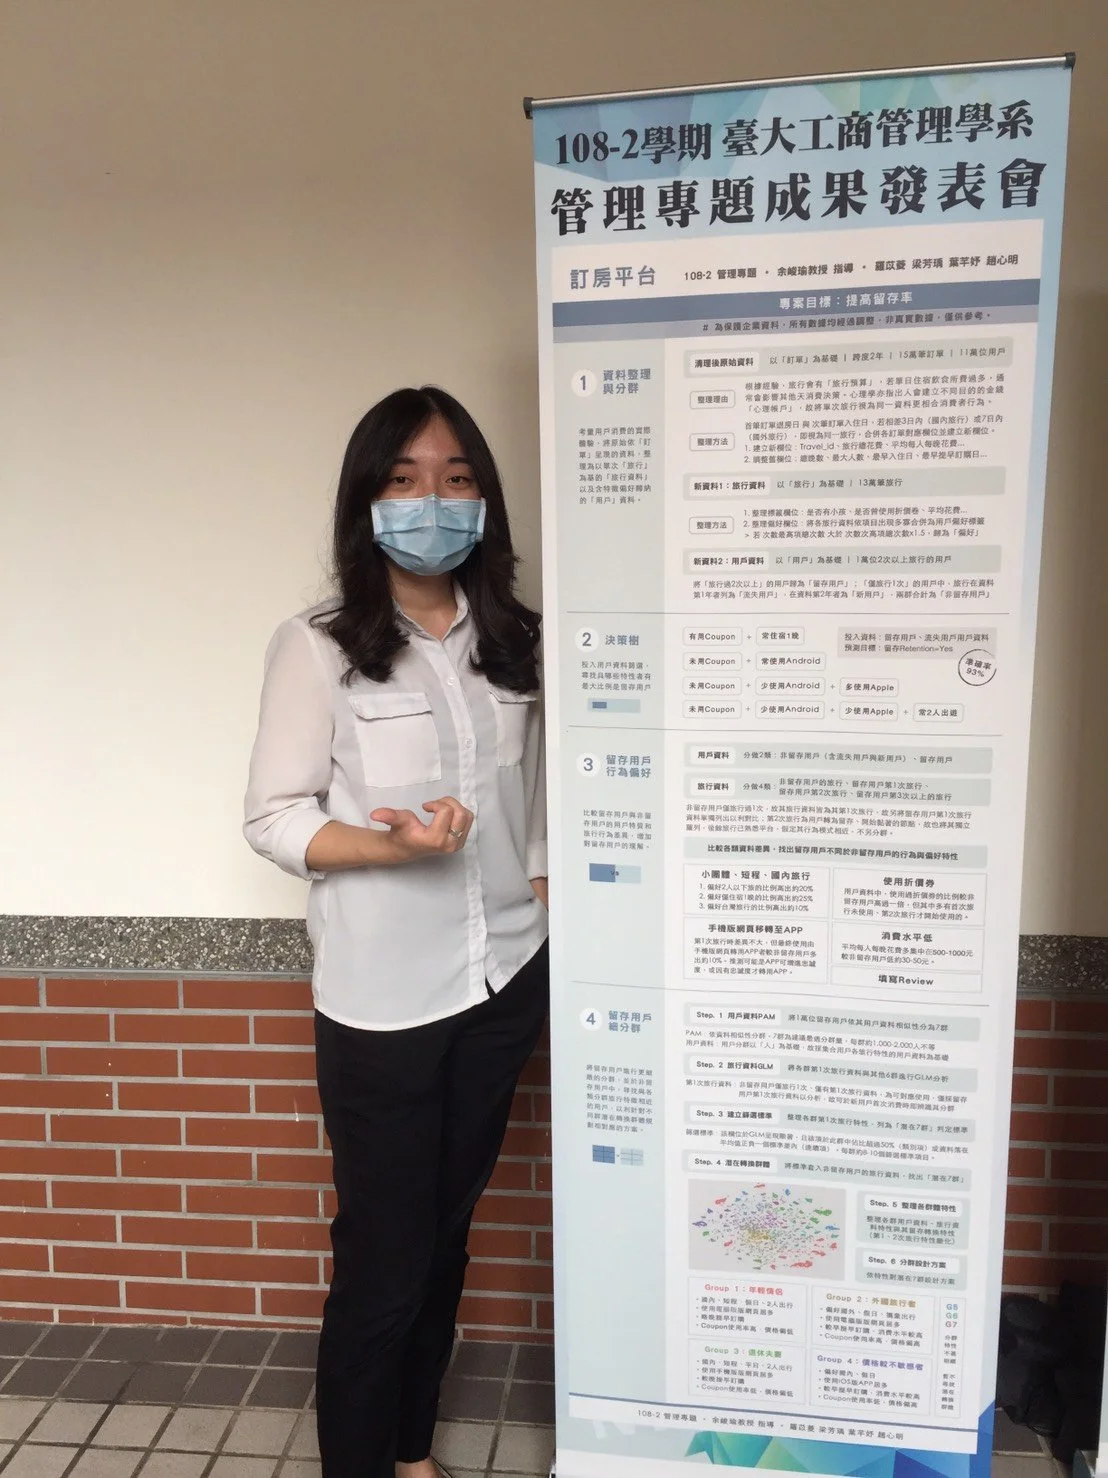
My team and I presented this project for our Capstone Project in Management (NTU Business Administration Class’20). The whole project was analyzed with R, Python and Excel, and was only for the use of our industry client.
# Personal contribution: team lead, information architecture reorganizing, analysis approach design, filtering criteria establishment
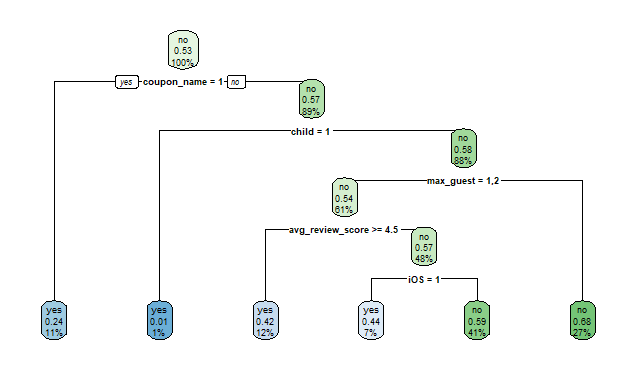
(above) Extend: Decision Tree for Retention
(left) Project Presentation Day

